
If you do not export your historical website data from GA3 (Universal) before the end of June, it will be lost forever. (If you already have a grasp on the gravity of the situation, click here to get to the actionable guide.)
What and when
Google released GA4 in 2023. Until that point, everyone was using Analytics Universal (which was GA3). GA3 Universal is being decommissioned by Google in 2024.
Your website’s historical data from GA3 (Universal) is still available in your old GA3 property. BUT on 1st July 2024, this data will be deleted permanently.
Every organisation now needs to export the last 10 years of website data if you want to be able to refer back to it and measure your current campaigns against past results.
Read the official statement HERE.
Why should I care?
In Marketing & Fundraising, our KPIs are based on growth on previous year’s results. Your source of truth for this data will be your CRM income reporting.
For digital fundraising, campaigning and marketing, your source of truth is Google Analytics eCommerce reporting. To plan for future targets and budgets, you need past data to inform your strategy.
Our websites were using Google Analytics 3 (Universal) from 2012 until July 2023. If you don’t export your org website’s historical GA3 (Universal) data, then the only website data you will have will commence from the date you moved over to GA4. That would be devastating for future planning.
What do I do?
We’ve done a lot of research, and unfortunately, you can’t just simply download an excel or PDF and your 10 years of history is saved. The method we’re using with our clients is exporting the data through data warehouse BigQuery and creating a Looker Report to display the data (option 1).
If you go down the BigQuery route like us (or need help), this requires:
- Purchasing a BigQuery package from Supermetrics to export data
- Developing an integration between Supermetrics and BigQuery to export data from GA3 (Universal).
- Creating a master Looker Studio report template to display the 5-10 years of historical web data for your website.
- Customising the Supermetrics + BigQuery integration for each organisation’s website/ GA property.
- Customising the Looker Studio report for each organisation’s website/ GA property.
If you don’t or can’t make an integration with a data warehouse like BigQuery, you can NOT save the underlying data.
Why? Because GA doesn’t have a “Download underlying data” button, that’s stored in several tables with many rows each. Ie. 1 MONTH of data alone from a charity could have up to 50,000 rows distributed in 6 different tables.. and that’s AFTER Supermetric’s processing of the information. Can you imagine how many tables you will have for 5-10 years of data across so many pages and campaigns and sources and mediums????
BUT, if you CAN’T invest in an integration with BigQuery to download ALL your data and use looker studio to display it (option 1), you should get the integration for at least the last year, to at least have some underlying data. You can then create reports later on with this data. (This is option 2.)
If you can’t do option 1 or option 2, then the last option is to at least export some key reports from your GA3 backend (option 3).
For option 3, to save SOME of the historical data, you will have to create reports in the backend of GA3 and export them:
- Built-in reports like:
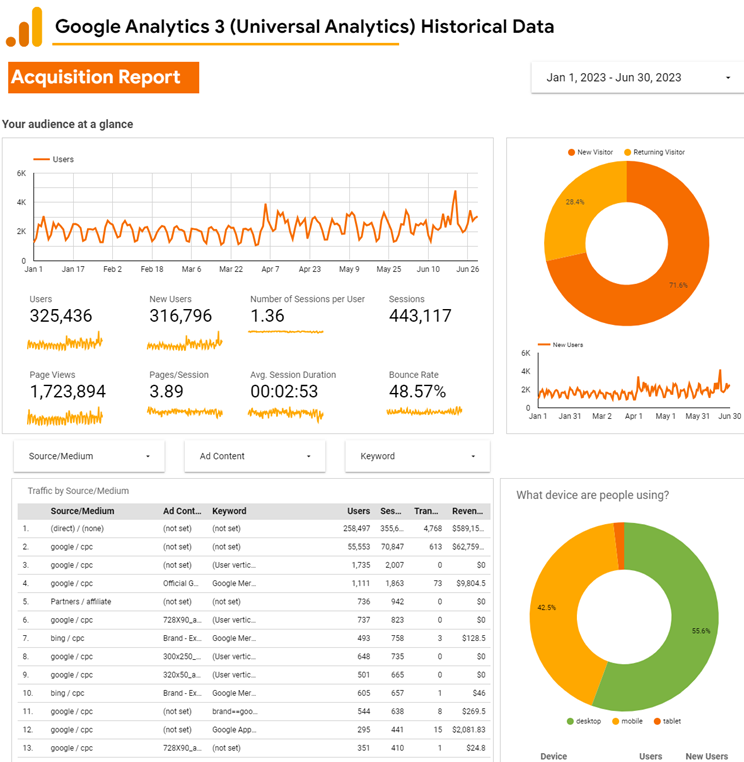
- Acquisition -> All Traffic -> Source/Medium
- Behaviour -> Site Content -> All Pages
- Behaviour -> Events -> Top Events
- Conversions -> Ecommerce -> Product Performance
- NB: The information you get is what you see, you won’t be able to adjust dates after exporting it.. so you can make one with the longest possible data range, or a few with shorter data ranges
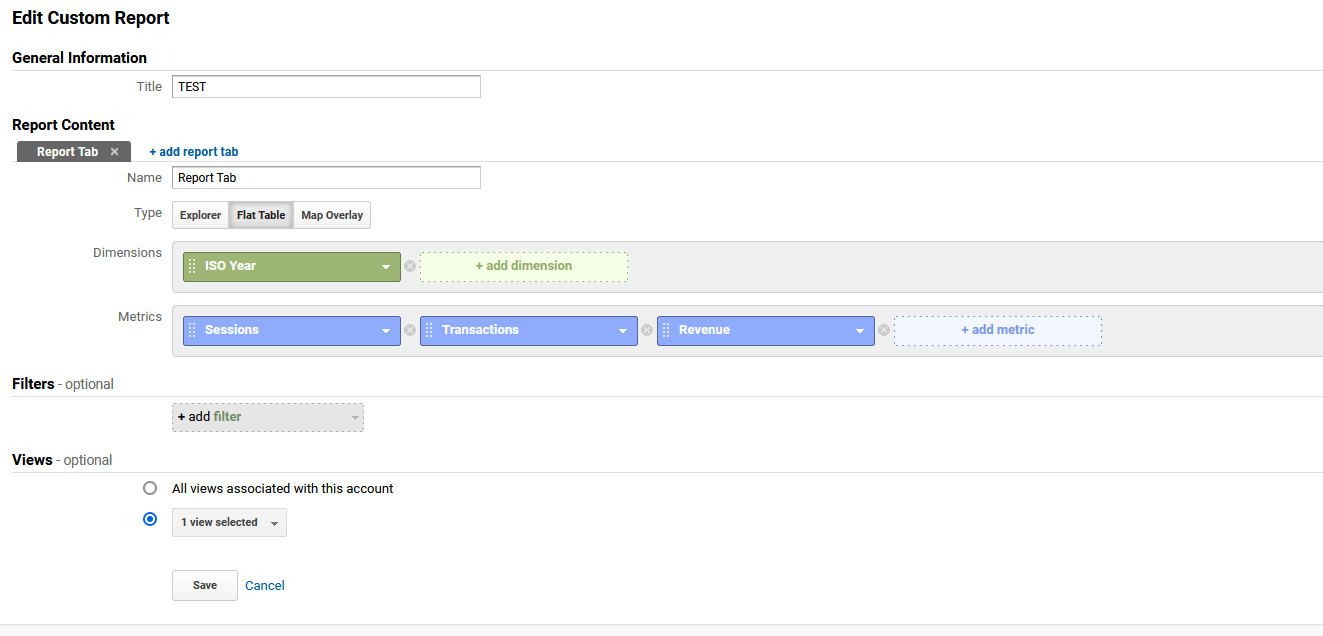
- Custom reports: Get more info here.
- Aggregated: Like the built-in ones, you set up a combination of broad dimensions and metrics that will be aggregated in the report.
- YoY: You can use only the dimension “Year” with a combination of whatever metrics you want (Sessions, Transactions, Revenue, etc) to get a YoY comparison on those. You can also add some other dimension but trying to keep it top-level (like “medium”) to have something comparable throughout the years
- By Date: The most similar approach to what you would get by doing the Big Query integration is creating reports opened by Date. The problem is that they grow exponentially. For instance imagine you want to know sessions per day in a month, that would be 30 rows (one per day) with their sessions. Now imagine you want to open the sessions by source/medium as well, now for each day you will have a row per source/medium in that day. We did a test, and each day has an average of 159 possible source/medium combinations, so suddenly your 30 rows became 4,770 (30×159) – add information about the landing page to that and you’ll be looking at 35,589 rows. And that’s just for 1 month and 3 dimensions.
Download guide
Need more help?
We hope this guide helps, but if you need support on exporting your GA3 data before 1st July, please get in touch ASAP.